
When your computer frequently freezes, programs respond slowly, or even reports errors frequently, insufficient memory (RAM) may be one of the important reasons. As a temporary data storage center when the computer is running, the capacity and usage status of RAM directly affect the smoothness of the system. This article will share three simple and practical methods for Windows and macOS systems to help you quickly grasp the memory situation and accurately judge whether you need to upgrade hardware or optimize usage habits.
Quick launch with shortcut keys: Press the Ctrl+Shift+Esc key combination to directly open the Task Manager; or right-click on the blank area of the taskbar and select "Task Manager".
View basic information: In the "Performance" tab, select "Memory" on the left, and the total memory capacity, current usage, and occupancy percentage will be displayed on the right. For example, "16GB (14.2/16GB) 89%" means the total memory is 16GB, the current usage is 14.2GB, and the occupancy rate is 89%.
Detailed process analysis: Switch to the "Processes" tab, click the "Memory" column header, and sort by memory usage from high to low. You can right-click to end processes with abnormal occupancy (such as unresponsive programs) to free up memory resources.
Advanced performance analysis: Click "Open Resource Monitor" at the bottom of the Task Manager. In the "Memory" tab, you can view the "Hard Faults" indicator (frequent occurrences require vigilance against memory failures or shortages), as well as each process's "Private Working Set" (actually occupied memory) and "Shared Working Set" (memory shared with other processes).
Launch Activity Monitor: Open Finder, go to "Applications - Utilities", and double-click "Activity Monitor"; or search directly through Spotlight (Command+Space).
Overview of memory usage: At the top of the "Memory" tab, the "Memory Pressure" graphical status is displayed. Green indicates sufficient, yellow indicates tight, and red indicates severe shortage. The "Memory Usage" area below displays detailed data such as total memory, used, available, and cached memory.
Process management: Click the "Memory" column to sort, select an abnormal process, and click the "Stop" button (⚠️ icon) in the upper left corner to force termination of the process and free up memory.
It is suitable for real-time monitoring of memory occupancy, quickly locating programs with high current occupancy, and temporarily solving the problem of lag caused by insufficient memory.

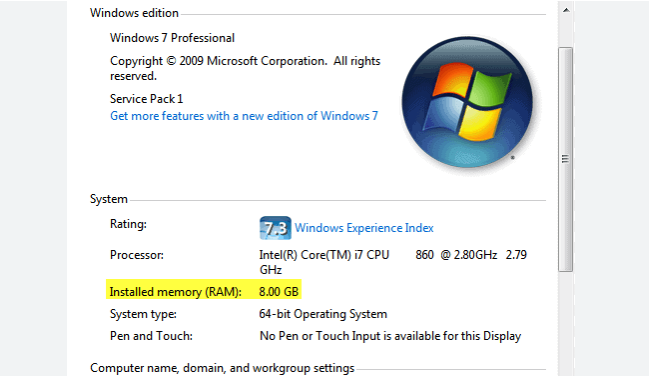
View basic configuration: Press the Win+Pause/Break key combination to open the "System" window. In "Device specifications", the "Installed RAM" capacity is directly displayed (such as "16.0GB").
Detailed memory usage: Go to "Settings - System - Storage - Advanced storage settings - Memory" (Windows 11 path), or "Settings - System - About - Related settings - Advanced system settings - Performance - Settings - Performance Options - Memory" (Windows 10). You can view the memory usage history chart to understand the memory occupancy trend in the past 30 minutes and identify whether there is a continuous high occupancy situation.
Upgrade compatibility query: In "Task Manager - Performance - Memory", view "Channels" and "Speed" information (such as "Dual Channel 2666MHz") to confirm the specifications of the existing memory, providing parameter references for subsequent upgrades (need to match the frequency and number of channels supported by the motherboard).
View hardware information: Click the Apple icon in the upper left corner of the screen, select "About This Mac", and the specific capacity is displayed in the "Memory" column (such as "8GB 2133MHz DDR4").
Memory usage report: Click the "System Report" button. In "Hardware - Memory", the usage status of each memory slot (installed/available), manufacturer, serial number, and other information are listed in detail, helping to determine whether there are expansion slots available (only for models with upgradeable memory).
It is suitable for understanding the memory hardware configuration of the computer (whether it can be upgraded, existing specifications), and analyzing long-term memory usage trends to determine whether hardware upgrades are needed.
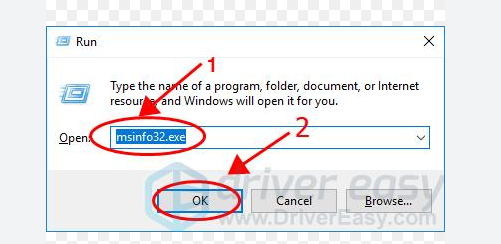
View physical memory information: Enter the command wmic memorychip get capacity,devicelocator,memorytype to display the capacity of each memory module (in KB, divided by 1024² to convert to GB), slot location (such as "Channel A-DIMM 0"), and type (such as "DDR4").
Memory diagnostic tool: Enter mdsched.exe to start the Windows Memory Diagnostic tool, select "Restart now and check for problems", and the system will automatically scan for memory errors when restarting to detect whether there are hardware faults (such as bad blocks).
In-depth analysis of process memory: Enter tasklist /fi "memusage gt 1024" to filter out processes with memory occupancy exceeding 1GB, and use the taskkill /im process name /f command to force termination (be cautious with critical system processes).
Detailed memory hardware information: Enter system_profiler SPHardwareDataType | grep -A 10 "Memory:" to display the specific model, frequency, and slot usage of the memory.
Real-time memory statistics: Enter top -o rsize to sort processes by memory occupancy, or use the vm_stat command to view virtual memory statistics (such as if the "Pages swapped out" value is too high, it indicates frequent use of hard disk virtual memory and insufficient memory).
It is suitable for advanced users to conduct in-depth diagnosis of memory hardware status, troubleshoot potential memory faults, or locate hidden background memory-occupying processes.
Long-term high occupancy warning: Observe through Task Manager / Activity Monitor. If the memory occupancy rate often exceeds 80% and is accompanied by frequent hard disk reading and writing (a large amount of virtual memory is used), it indicates insufficient physical memory.
Feasibility of hardware upgrade: Check the memory slot status in the system settings (such as "2 slots, 1 used") to confirm whether there are free slots or replaceable low-capacity memory modules.
Matching usage scenarios: If you often run large software (such as Photoshop, video editing tools), multitask (opening more than 20 browser tabs at the same time), or use virtual machines, it is recommended to configure at least 16GB of memory; gamers need to choose according to the recommended configuration of the game (such as 3A masterpieces usually require 16-32GB).
Through the above three methods, users can fully grasp the computer's memory capacity, usage status, and hardware configuration. Temporary freezes can be quickly solved by terminating abnormal processes through the Task Manager. For long-term performance problems, it is necessary to combine system settings and command line tools to determine whether memory upgrade or usage habit optimization is needed. It is recommended to check the memory usage regularly (once a month) to find potential problems in time and ensure that the computer always runs smoothly. If memory hardware faults are found during the inspection (such as frequent hard errors, unrecognizable slots), please contact professional maintenance personnel for inspection and replacement in time.

